Follow a squad’s trend over time
Use the Trend report to see each athlete’s change per day, week, or month as colored percentage chips, with their latest value and their change across the window.
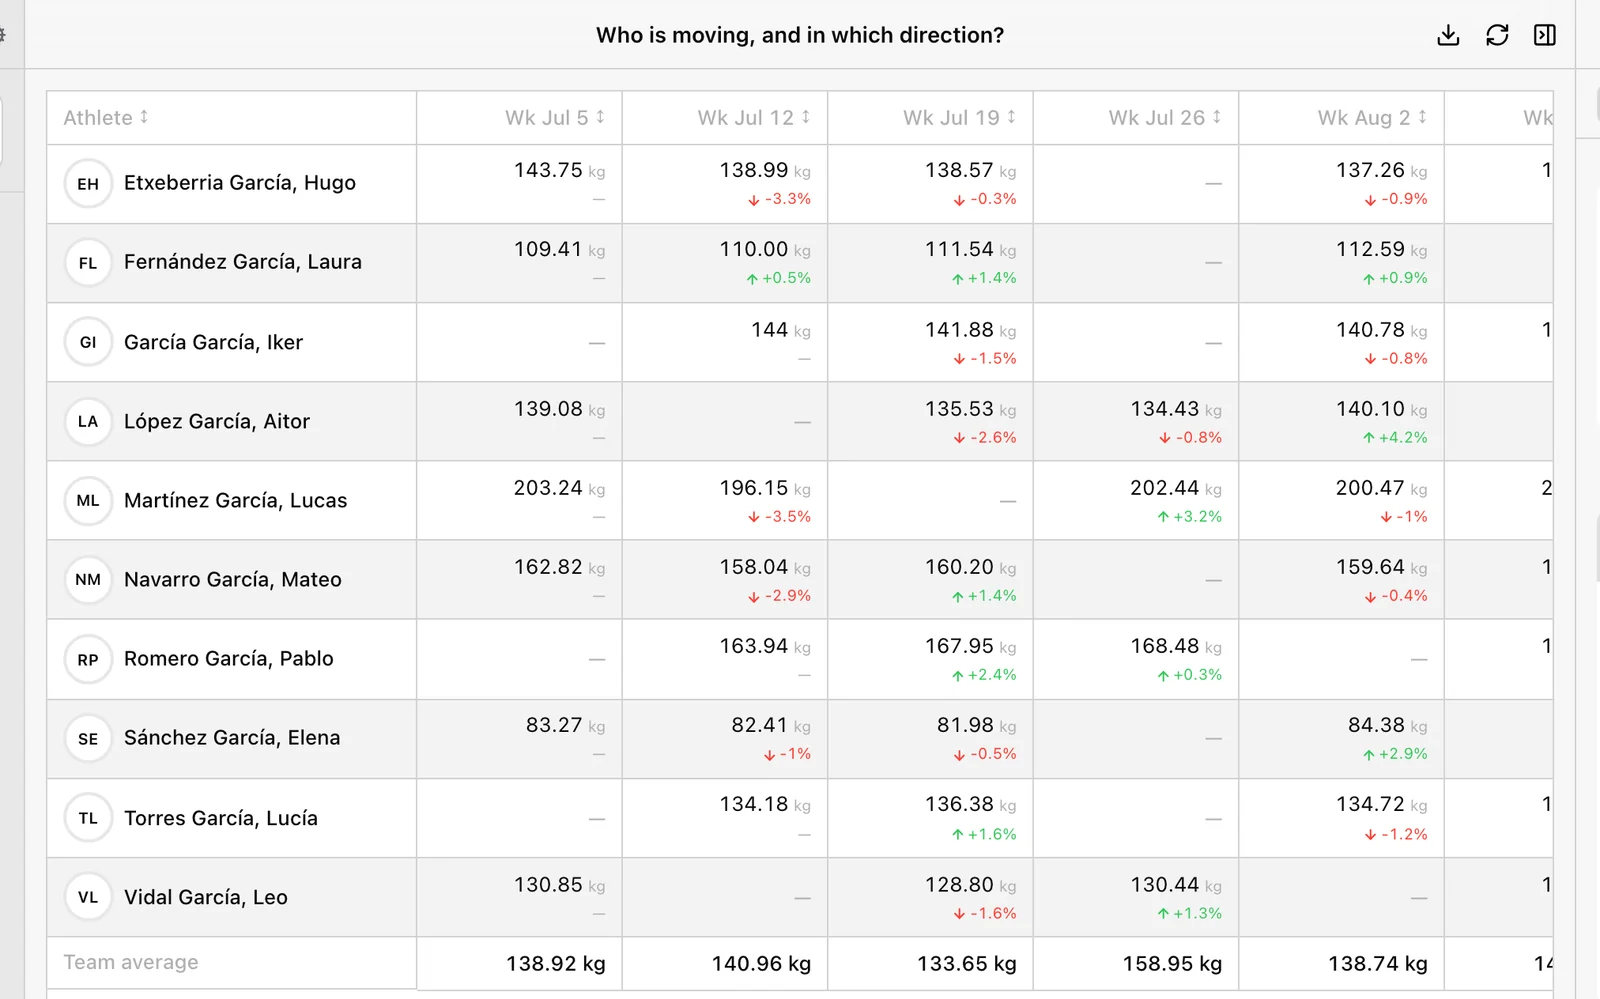
Trend answers “Who is moving, and in which direction?” It reads one metric for every selected athlete, period by period, so you can see who is improving, who is stalling, and who is dropping.
Open Labs → Reports → Trend. The board needs a window 1024 px or wider.
Set it up
- In Setup, choose Date, the team or athletes, and any athlete filters.
- Under Metric, choose the metric, its Calculation, and an Exercise if it needs one.
There is no period-size control: the window decides the columns.
| Window length | One column per | Column label |
|---|---|---|
| Up to 31 days | Day | 12 Mar |
| Up to 93 days | Week | Wk 12 Mar |
| Longer | Month | Mar 26 |
The calculation runs inside each period. Average 1RM per week is the mean of that week’s readings; Count of tonnage is the total lifted that week.
Read the table
Each row is an athlete and each period is a chip showing the percentage change from the athlete’s previous reading. Empty periods are skipped, so a week off is not read as a drop.
- Chip colors follow the sign of the change, not the metric’s direction: green shades for an increase, red shades for a decrease. The larger the change compared with the largest one on the board, the stronger the shade. A chip with no change stays neutral. For a sprint time, a faster week is red, so read the number, not just the color.
- — in a chip means there is nothing to compare: the athlete’s first reading, or a period without a reading (dashed outline).
- A small dot in the corner marks the athlete’s latest reading.
- Latest / change, the last column, shows the athlete’s latest value and the change from their first reading to their latest, as a percentage. Here the color does follow the metric’s direction: green is better, red is worse. Underneath is the period of the latest reading, or First reading when there is only one.
- Team average, in the footer, is the squad’s average in each period, shown with the same chips.
Hover, click, or focus a chip to read it in the bar under the table: the athlete, the period, the value, the change vs previous, the Previous reading, and the Team average for that period. The bar starts on the team’s latest period. With a chip focused, the left and right arrow keys move along the row.
Above the table, the header counts the athletes improving and declining between their first and latest reading, following the metric’s direction, and shows the Squad change: the team average’s change across the window.
Sorting a period column sorts by that period’s change, not by the value, so you can bring the biggest movers to the top. Latest / change sorts by the change across the window, and the athlete column by name. Click a header again to reverse the order, and a third time to return to the roster order.
Presets
| Preset | Question |
|---|---|
| Deadlift 1RM over time | Is the pull getting stronger? |
| Bar speed on heavy deadlifts | The same load moving faster is the adaptation (sets averaging 0.40–0.60 m/s). |
| Velocity loss within the set | Is the squad holding the prescribed effort? |
| Weekly tonnage | Volume delivered, week by week. |
| Countermovement jump height | The average of the trials, which reads fatigue better than the best one. |
| Wellness | How the squad says it feels. |
Export and empty states
Download CSV writes, for each period, the value, the change in %, and the team average, plus a final Growth (%) column.
- Pick a metric to follow: choose a metric, and an exercise if it needs one.
- No measurements in this window: widen the window, or choose another exercise or metric.
For one athlete across many lifts at once, use the Trends tab of their Profile instead.
Compare athletes metric by metric
Use the Comparison report to read up to twelve metrics side by side for a squad, color the best and worst values, and export the table.
Rank athletes on up to six metrics
Use the Ranking report to order the squad on several metrics side by side, each best first in its own direction.