Review an athlete profile
Read one athlete’s metric cards, their trend per exercise, how they rank against a group, and every new personal best in the window.
Profiles read everything you track for one athlete. Where Insights go deep into one kind of work, a profile gives the broad picture: strength, jump, speed, body, and workload on one page.
Open Labs → Profiles and pick the athlete from the list on the left. Search by name, or use the filter button to narrow the list by team or athlete attributes.
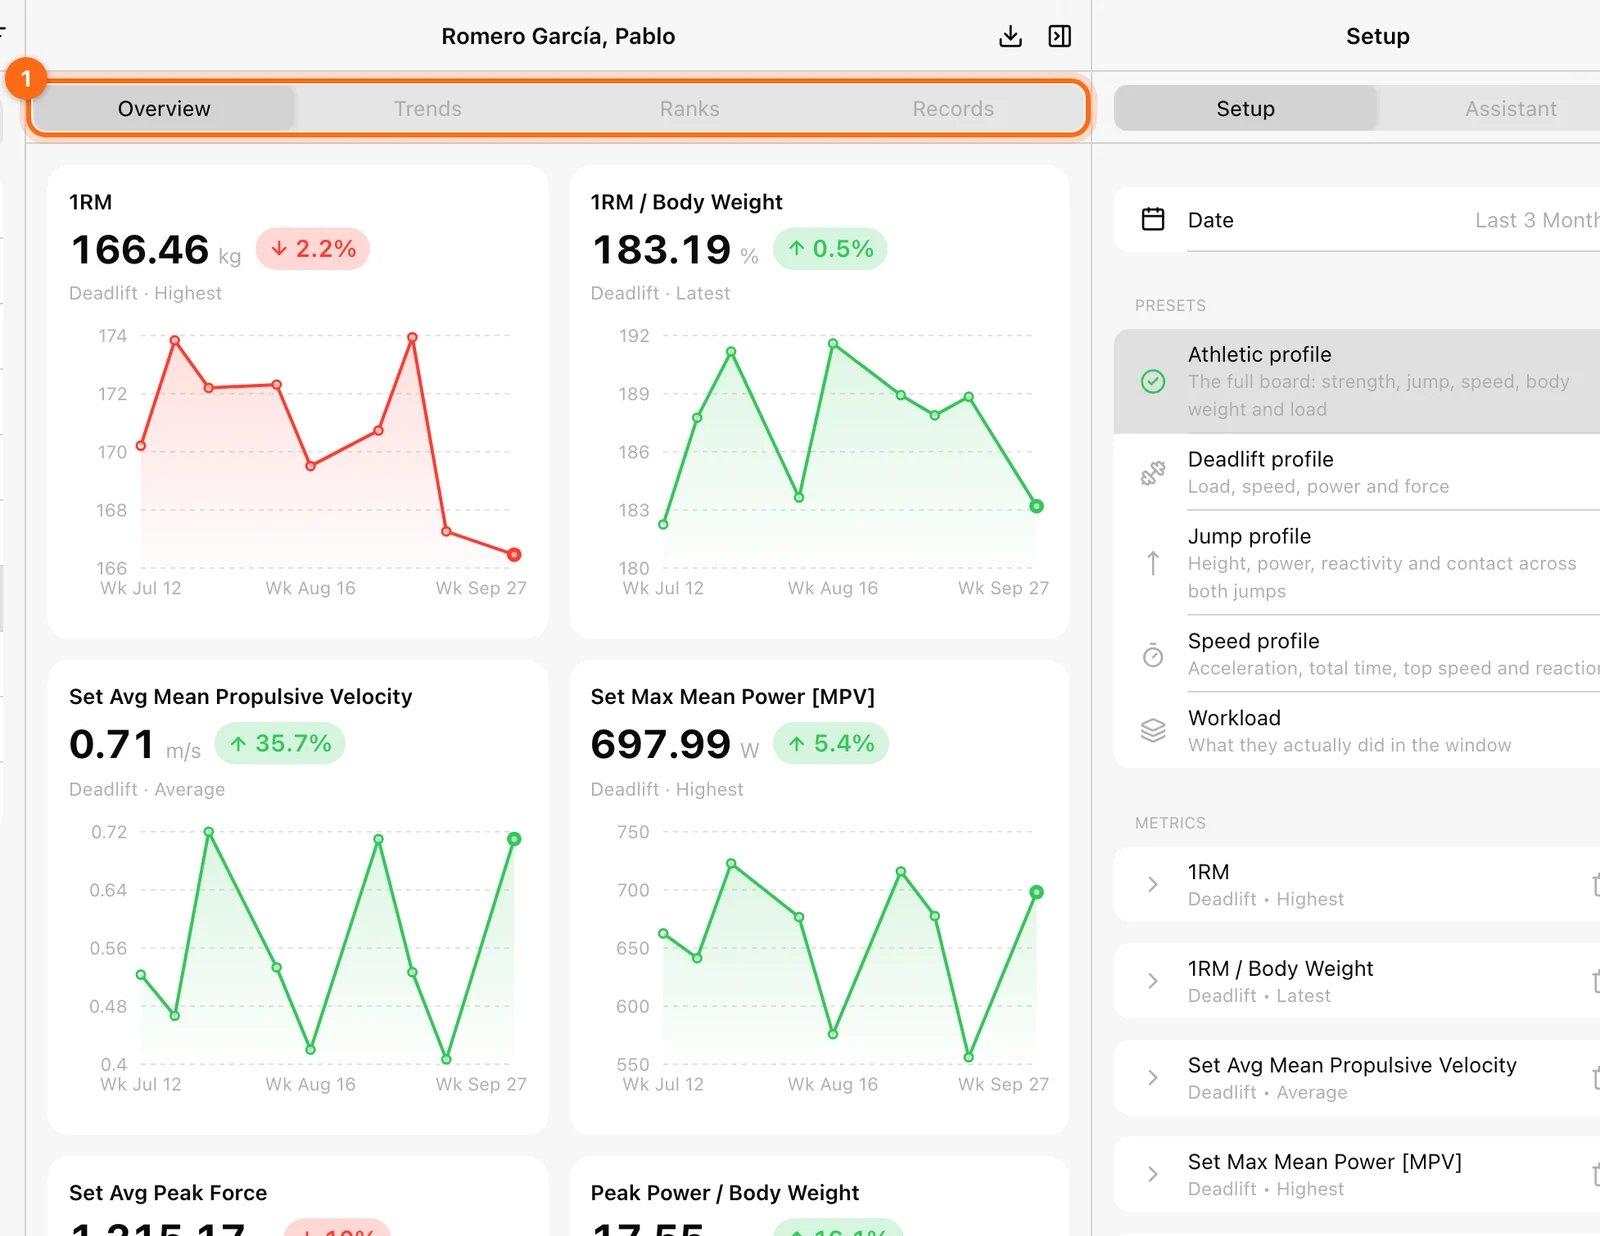
The four tabs
| Tab | Question |
|---|---|
| Overview | How is this athlete doing on each metric I follow? |
| Trends | Which lifts are going up, period by period? |
| Ranks | Where do they stand against a group? |
| Records | When did they set a new best? |
Selecting another athlete keeps the tab you are on, so you can walk through the squad on the same view. Each tab has its own setup and its own My presets.
The setup belongs to the board, not the athlete: the window, presets, and metrics apply to every athlete you open. All tabs open on Last 3 Months. The period length (days, weeks, or months) follows the window, as on Trend.
Overview
One card per metric, up to 16. Add and configure metrics in Setup as on any board (see Metrics and calculations), or apply a preset:
| Preset | What it shows |
|---|---|
| Athletic profile (default) | Strength, jump, speed, body weight, and load. |
| Deadlift profile | Load, speed, power, and force. |
| Jump profile | Height, power, reactivity, and contact across both jumps. |
| Speed profile | Acceleration, total time, top speed, and reaction. |
| Workload | What they actually did in the window. |
Each card shows:
- The value of the latest period, with its unit.
- A change chip: from the first to the last period, green when it moved the good way, red when it moved the bad way.
- A detail line: exercise, calculation, and, if you filtered them, phase and source (Entered manually or Tracked).
- A chart of every period, with the latest highlighted. For lower-is-better metrics the axis is flipped, so up is always better.
“One reading, nothing to trend yet” and “Not measured in this window” are normal for metrics the athlete trains rarely. The footer counts how many metrics were measured.
Trends
A table with one row per exercise and metric and one column per period. It needs a window 1024 px or wider.
By default it follows the 1RM of 16 main lifts (bench press, squats, deadlifts, cleans, presses, rows, hip thrust, snatch). Change the rows in Setup, up to 16; the same metric can appear for several exercises.
- Each cell shows the value, with the latest period in bold, and the change from the previous period that has a value. Gaps are skipped, so a missed week is not read as a drop.
- Growth beside the exercise name is the change from the first to the last measured period.
- Sort a period column to bring the biggest changes to the top.
Ranks
Places the athlete against a group, metric by metric.
- Under Rank against, choose the group: Date, Team, Athletes, and filters. Selecting nobody means the whole roster. The athlete is always included.
- Choose the Operation applied to every metric: Average, Highest (default), Lowest, or Count.
- Add up to 12 metrics.
Each card shows the athlete’s rank (#3 of 18), their value, the share of the group they are Ahead of, and the Group average.
- Rank colors: in a group of three or more, the top third is green, the bottom third red, and the middle blue.
- Field strip: every group member is a faint dot, worst on the left and best on the right, with the group average as an orange line and the athlete as a solid dot.
- Bars: the athlete’s recent periods against the group average.
Only athletes measured in the window are ranked.
Records
Shows when the athlete set a new best. It needs a window 1024 px or wider.
A record is a period that beats every period before it in the window: higher, or lower for metrics where less is better. There is no calculation to choose; each metric is read at its best.
Add up to 12 records with Add record. By default: deadlift 1RM, deadlift max mean power, countermovement-jump height, drop-jump RSI, and dash lap time.
Each card shows:
- The best value in the window.
- A chip: No new best, or the number of records (gold).
- A chart of the best per period, with a dashed gold Record to beat line and a gold dot on every period that set a new best. The first period is the starting mark, not a record.
- A list of each record, newest first, with the gain over the previous mark.
Export and where settings live
Download CSV is available on Overview, Trends, and Records. Profile setups and presets are kept in this browser on this device.
To investigate a change in depth, open the athlete in Insights. To find the sessions behind a value, use History.
Understand Labs metrics and calculations
What each calculation means, why Count is a total, how metric direction drives colors and ranks, and how exercise, source, phase, and value filters narrow a metric.
Compare athletes metric by metric
Use the Comparison report to read up to twelve metrics side by side for a squad, color the best and worst values, and export the table.