Rank athletes on up to six metrics
Use the Ranking report to order the squad on several metrics side by side, each best first in its own direction.
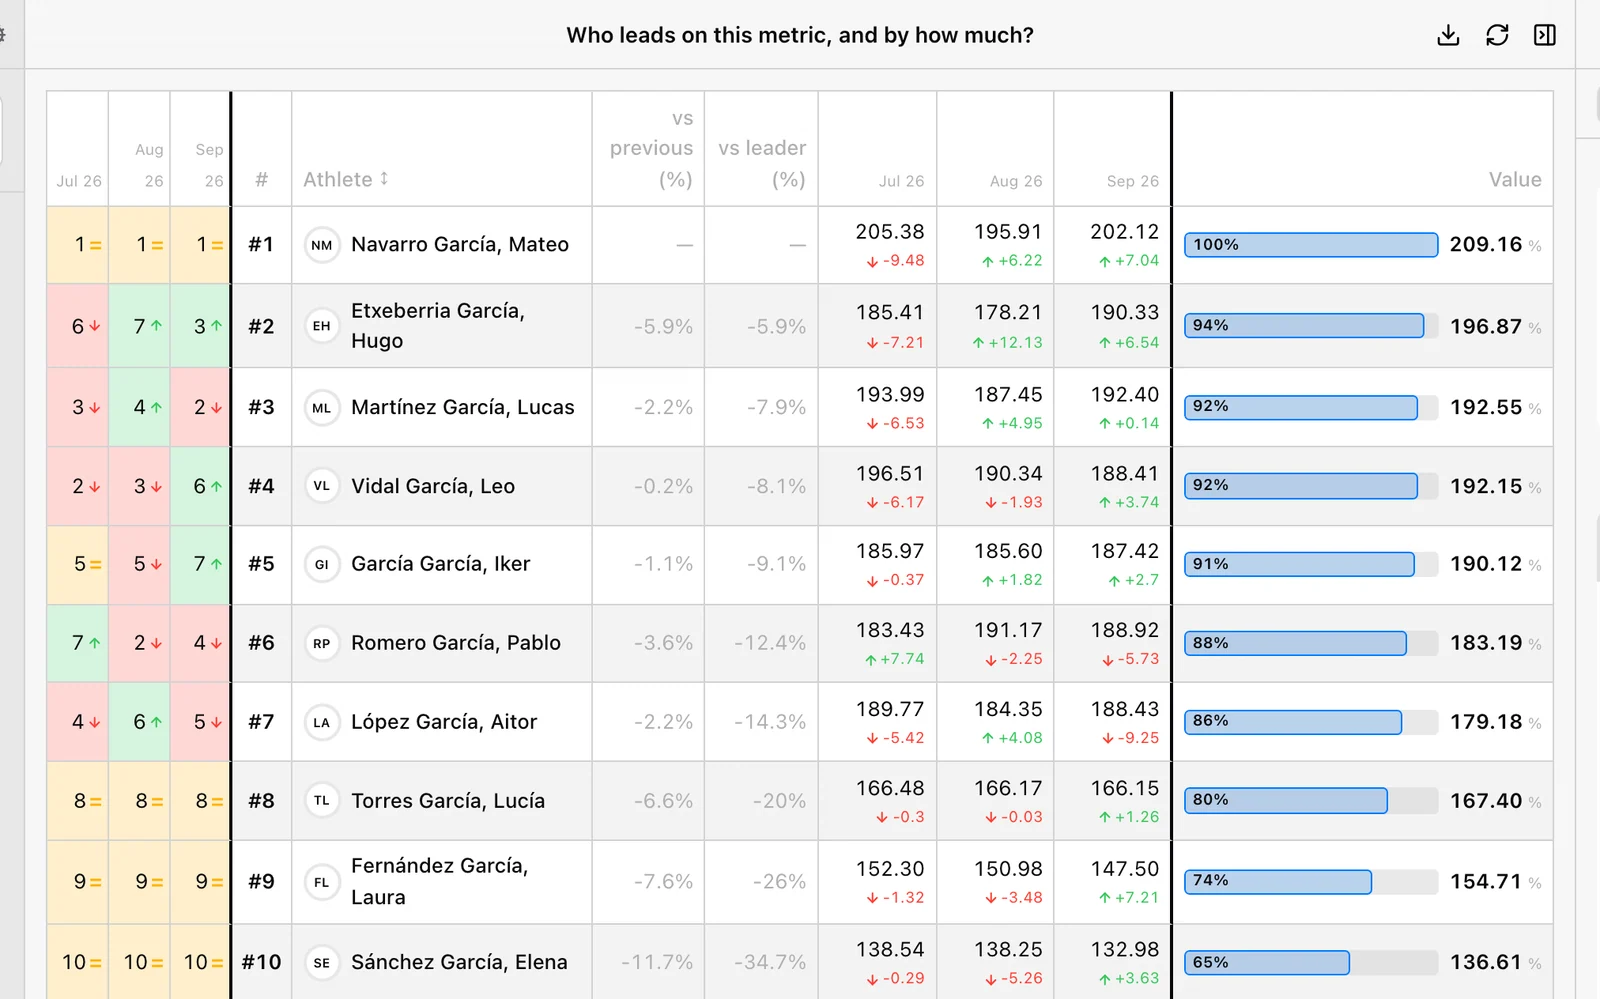
Ranking answers “Who leads on each metric?” Each metric gets its own ranked list, and the lists sit side by side so you can see who leads on strength, on jump, and on speed at the same time.
Open Labs → Reports → Ranking. The board needs a window 1024 px or wider.
Set it up
- In Setup, choose Date, the team or athletes, and any athlete filters.
- Under Metrics, add up to six metrics. The Calculation beside each decides what is ranked: a latest reading, a window average, or a best (Highest / Lowest).
- Pick an Exercise for metrics that are only comparable inside one.
A new board ranks deadlift 1RM per body weight (latest), countermovement-jump height (highest), and dash lap time (lowest). Ranking has no curated presets, but you can save your own with Save as preset.
Read the lists
- Each list header shows the metric and its exercise, calculation, and unit.
- Athletes are ranked best first in that metric’s direction: highest first for most metrics, lowest first for times and other metrics marked ↓.
- Ranks are consecutive (#1, #2, #3…). Tied values still get different ranks.
- Athletes with no value in the window are left out of that list. A note under it says how many: “N athletes have no value in this window.”
- “Nobody was measured in this window” or “This ranking failed to load” apply to one list only; the others still read.
You can sort each list by rank, athlete, or value. The board scrolls sideways when six lists do not fit.
Ranking, Leaderboards, and Profile ranks
- Ranking is a configured analysis over a date window for the selected squad.
- Leaderboards (outside Labs) is a training surface that can also show an active session live. See Leaderboards.
- The Ranks tab of an athlete’s Profile places one athlete against a group you choose.
Do not expect these to refresh or aggregate identically.
Export and empty states
Download CSV writes one row per athlete with, for each metric, their rank and value.
“Pick what to rank” means no metric is ready: add one, and pick an exercise where it is required.
Follow a squad’s trend over time
Use the Trend report to see each athlete’s change per day, week, or month as colored percentage chips, with their latest value and their change across the window.
See how spread out the squad is
Use the Distribution report to place every athlete on one metric, grouped into segments around the squad mean or median.