Understand Labs metrics and calculations
What each calculation means, why Count is a total, how metric direction drives colors and ranks, and how exercise, source, phase, and value filters narrow a metric.
A Labs value is always a metric, read with a calculation, inside a window, under some filters. Two boards that disagree are usually reading one of these differently. Check all four before concluding that something is wrong.
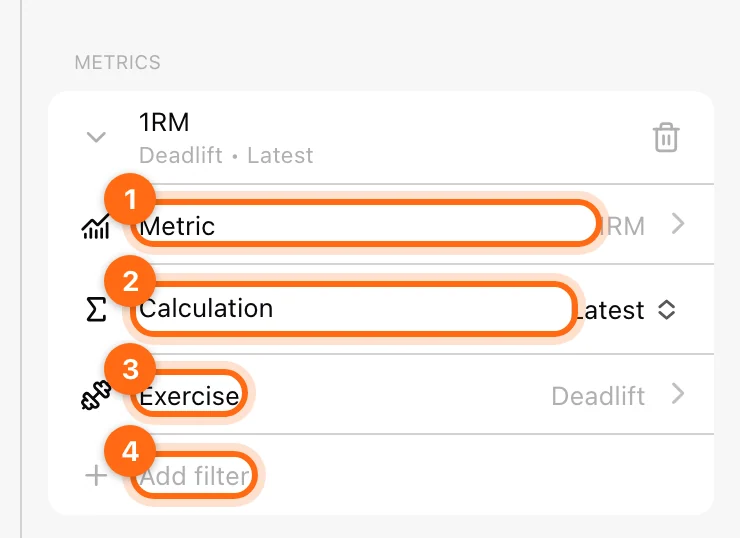
Calculations
The Calculation list only offers what makes sense for the metric.
| Calculation | Reads | Good for |
|---|---|---|
| Latest (default) | The newest qualifying reading in the window. | Current state: latest 1RM, latest body weight. |
| Average | The mean of all qualifying readings. | Typical level: average velocity, average sleep. |
| Highest | The highest reading. | Bests: highest jump, heaviest load. |
| Lowest | The lowest reading. | Bests for times: fastest sprint, shortest contact. |
| Median | The middle reading. | A typical level that ignores outliers. |
| Percentile | The reading at the percentile you enter (1–99, default 50). | Robust near-bests, such as the 90th percentile of velocity. |
| Standard deviation | How much readings vary. | Consistency. |
| Count | The total of an additive metric. | Volume: total repetitions, tonnage, distance, sessions. |
Count is a total, not a number of readings
Count of tonnage is the kilograms lifted in the window, and Count of repetitions is the reps performed. It is not how many times the metric was recorded. Performance metrics such as velocity do not offer Count.
On Trend, Profiles, and dashboards the calculation runs inside each day, week, or month rather than over the whole window.
Direction: higher or lower is better
Most metrics are better when higher. Metrics where less is better, such as sprint times or ground contact time, show ↓ after their name. Direction decides:
- which end is green and which is red on Comparison and Trend,
- the order on Ranking (lowest first for ↓ metrics),
- percentiles on Benchmarks (flipped so a higher percentile is always better),
- the good quadrant on Relationship,
- which way the chart axis runs on Profiles and Insights (flipped so up is always better).
Distribution is the exception: its colors show position in the spread only.
Exercise
Many metrics only make sense inside one exercise. A deadlift 1RM and a bench press 1RM cannot be averaged together. These metrics always show an Exercise row, which cannot be removed, and the board waits until you pick one.
A built-in exercise and a similarly named custom exercise are different exercises. If a board is empty, check that you picked the one your athletes actually recorded.
Metrics such as body weight, sleep, wellness, and workload totals do not need an exercise.
Filters on a metric
Inside a metric block, Add filter offers only what that metric supports:
| Filter | Options | Use |
|---|---|---|
| Data source | Anything, Hardware, Manually | Keep only device readings, or only values entered by hand (for example in Scoresheet). |
| Repetition phase | Both phases, Concentric, Eccentric | Read only the lifting or the lowering phase. |
| Metric value | Specific value or Value range on another metric | Read only some sets, for example sets averaging 0.40–0.60 m/s, to compare heavy work only. Up to two per metric. |
A Metric value filter cannot be combined with the Manually source, because manual values have no sets to narrow.
Each metric block is independent. On Comparison, one column can read heavy sets only while the next reads every set.
Units
Labs shows values in your preferred units (kg or lb, cm or in) and converts what you type in Scoresheet. Velocities are in m/s. See Units and appearance.
Missing values
— means nothing qualified for that athlete in the window. It is never treated as zero: averages, ranks, and percentiles leave the athlete out instead.
Set up a Labs board
Use Setup to choose the date window, team, athletes, athlete filters, and metrics, save and manage presets, and refresh, export, or ask the Assistant.
Review an athlete profile
Read one athlete’s metric cards, their trend per exercise, how they rank against a group, and every new personal best in the window.